
ArcGIS Exercise of Generalization Toolset in ArcGIS Pro
This exercise aims to use generalization toolsets in ArcGIS Pro Cartography toolbox to discover the range of generalization utilities available and discern their differences. Main workflow includes:
-
Create a new Spatial ETL tool in ArcGIS Pro and transfer the data format from E00 to a geodatabase.
-
Start exploring the generalization tools in ArcGIS Pro by simplifying the coastline of the Andros Islands and representing it appropriately at a scale of 1:1,500,000. The following tools were used in this exercise:
-
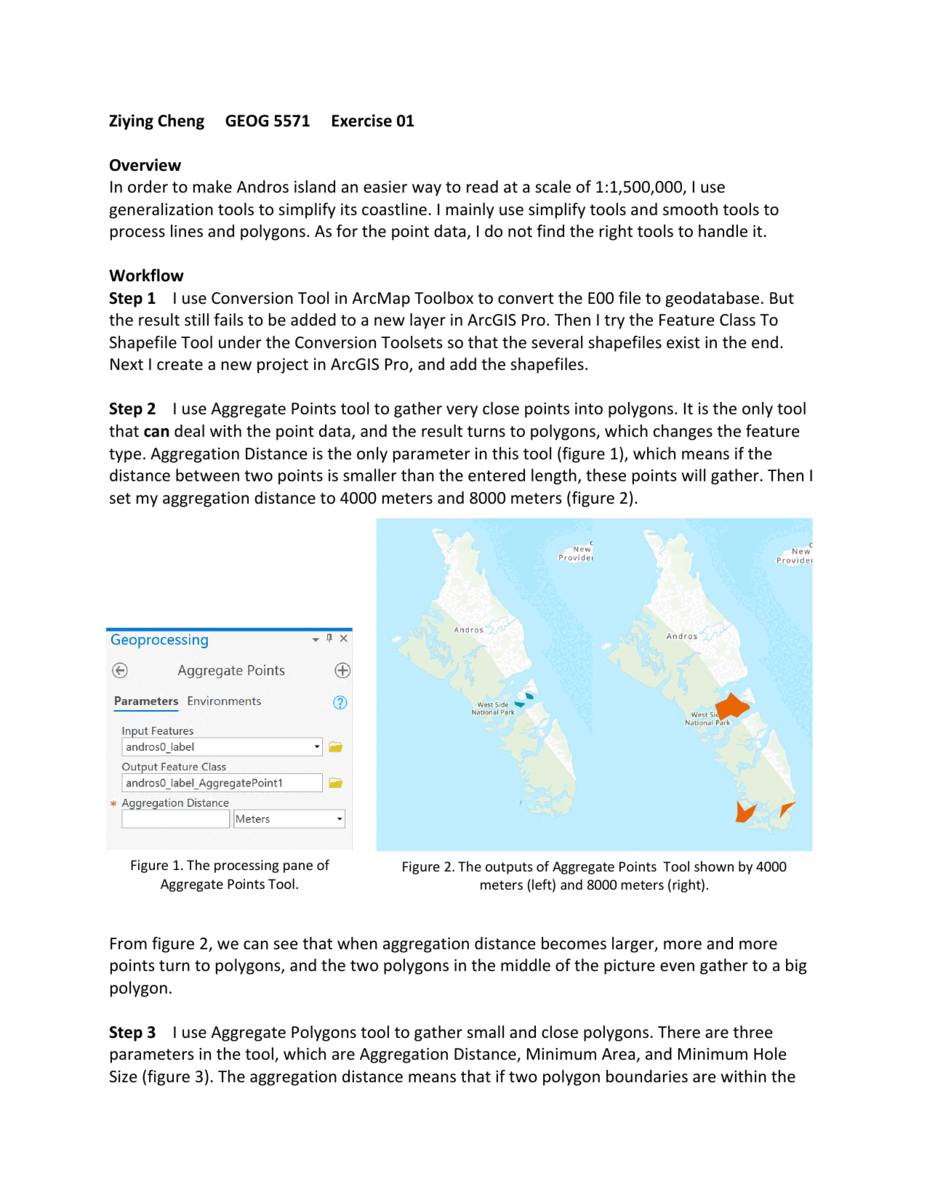
Aggregate Point
-
Aggregate Polygon
-
Simplify Polygon with Douglas-Peucker and Wang-Müller simplification algorithm
-
Smooth Polygon with both PAEK and Bezier interpolation smooth algorithms
-
Simplify Line tool with Douglas-Peucker and Wang-Müller simplification algorithm
-
Smooth Line with both PAEK and Bezier interpolation smooth algorithms
-
ArcGIS Exercise of Projection Transformation in ArcGIS
This exercise focuses on customizing a specific geographic coordinate system and a projected coordinate system for the projection transformation and it consists of three distinct parts:
-
The primary task for the first part consists of re-projecting a world base map showing major countries. Secondary tasks include reestablishing proper polygonal boundaries and using some minor editing facilities in ArcGIS Pro.
-
The primary task for the second part consists of duplicating the first part but starting from a shapefile, rather than a feature class.
-
The third part involves re-projection in Jupyter Notebooks with arcpy.

ArcGIS Exercise of TIGER/Line Data (large dataset)
The goal of this exercise is to use ArcGIS Pro to extract two data sets from the TIGER/Line data: polygons representing the 2000 census tracts; and polygons representing the 2000 block groups.
Several tools like Select By Attribute/Location, Calculate Field, Add Relate, Feature To Polygon, Polygon To Line are used in this exercise.

ArcGIS Exercise of Digitizing in ArcGIS Pro
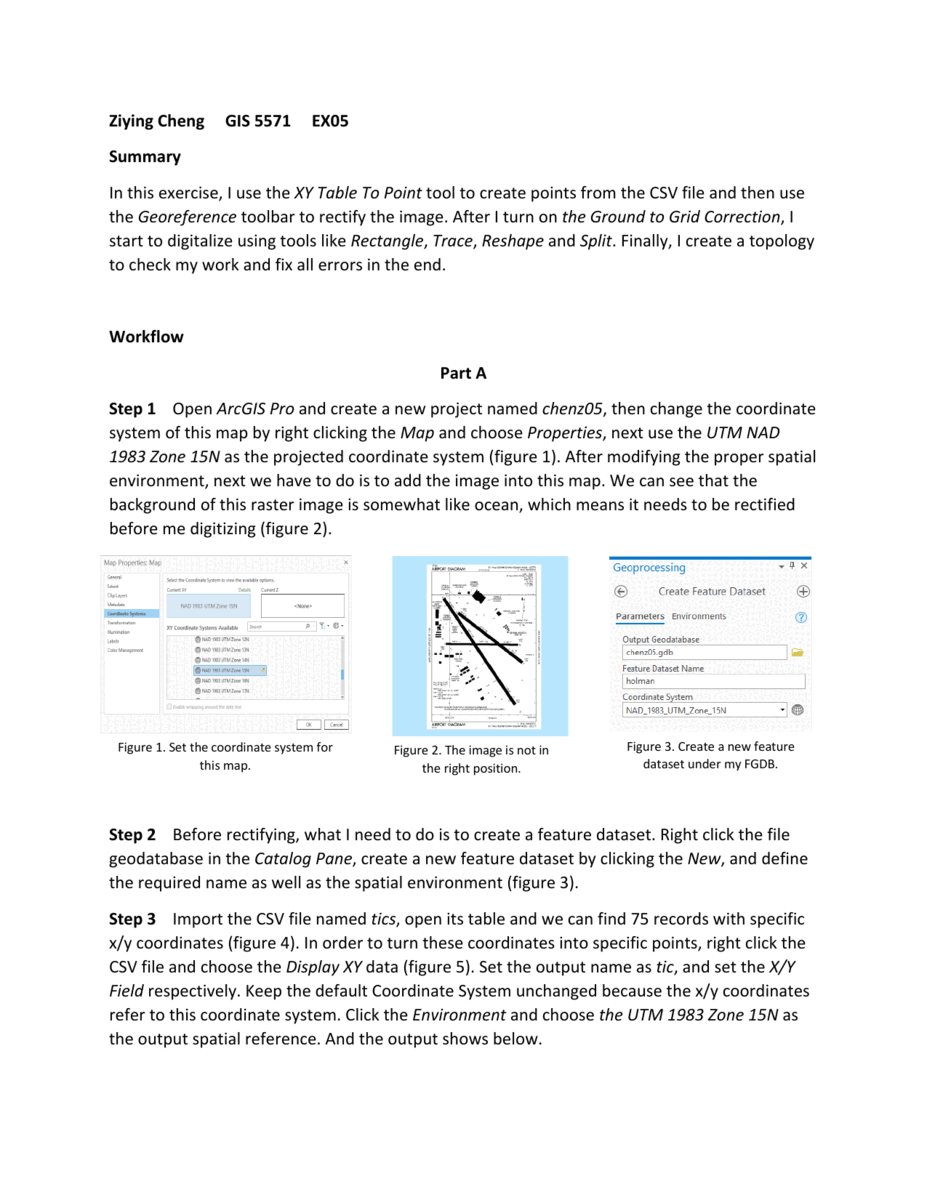
The goal of this exercise is to digitize the St. Paul Downtown Airport from a TIFF image file. The resulting feature classes should include polygons for buildings, runways, and taxiways, as well as points for tics. Additionally, the subtypes, georeferencing, and accuracy are taken into consideration during the process.
ArcGIS Exercise of Geolocation Service
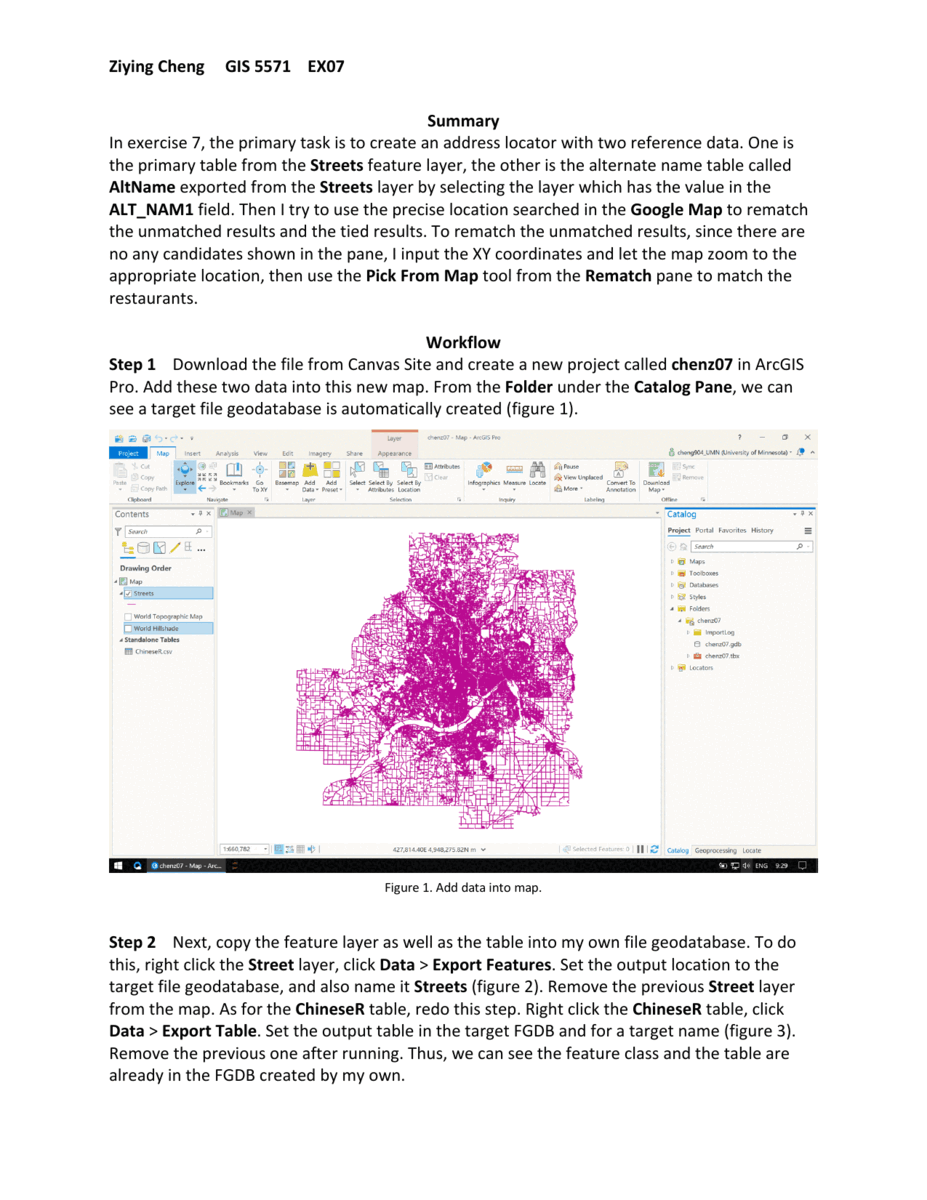
The primary objective for this exercise is to use Geolocation services in ArcGIS Pro with an existing dataset to locate all the Chinese restaurants in the Twin Cities metro area. The data were extracted from a website featuring different restaurants and were used in an actual research problem. It consists of two entities: a database containing street centerline for the Twin Cities (extracted from the TIGER/Line data) in a compressed file geodatabase format; and a file containing restaurant data in a CSV file. The exercise includes the following big steps:
-
construct an Address Locator based on the Streets feature class
-
Perform address matching for the restaurants using the created geolocation service(address locator)
-
To rematch the unmatched and tied results, use the precise location that was searched for in Google Maps.
ArcGIS Exercise of DEM with Land Cover
This exercise is to summarize the landcover categories for Lake County, Minnesota, with respect to elevation and railroads in 4 tables. There are three inputs for this exercises:
-
Landcover classification (NLCD) from USGS;
-
DEM from Minnesota DNR;
-
Railroad coverage from Minnesota DOT
And the four output tables are:
-
Landcover percentages by elevation
-
Landcover percentages across elevation categories
-
Landcover percentages by areas near and far from railroad lines
-
Landcover percentages across areas near and far from railroad lines
Table 1 and 2 are identical for pixel counts, but differ in how percentages are calculated. For Table 1 landcover percentages for each elevation category should sum to 100%. For Table 2 landcover percentages should sum across elevation categories to 100%. See the key. Likewise, Tables 3 and 4 are identical for pixel counts and are structured similarly using near and far from railroad instead of elevation class, but differ from how percentages are calculated.

PostgreSQL Exercise: Working with 2000 Census Tracts
Create a US 2000 census table and load the dataset from local CSV files into the database, and complete the following queries:
-
Select from the dataset the following states: Minnesota, Alabama, Wisconsin, Illinois.
-
Which state has the most census tracts?
-
Which state has the largest population?
-
Which state has the largest population of people over the age of 65?
-
Which state has the largest population of people 17 and under?
-
What are the top 10 states with the largest populations?
-
How many counties are in each state?
-
Which state has the largest population of American Indians?
-
Which census tract has the largest proportion of male to women ratio?
-
Which states have the top 10 census tracts with unequal ratios in men and women?
-
Which census tracts have a majority minority population? --minority population is defined as non-white population. Find the census tracts that have more minorities.

PostgreSQL Exercise: Working with Functions and Data Management
The purpose of this exercise is to practice the basics of database management including Create, Read, Update, and Delete (CRUD) through the Iowa Liquor Sales and Denver Crimes spreadsheets, and utilize the some basic PostgreSQL functions:
-
aggregate functions
-
string functions
-
date time functions
with the following queries:
-
On what date (invoice_date) was the most total sales of liquor?
-
Which store (store_name) had the largest liquor sales?
-
Which county sold the least liquor?
-
Report for every category the min, max, and total sales?
-
How much more liquor was sold in 2012 compared to 2016?
-
Provide the data definition language (DDL) information used for creating the denver_crimes table
-
Provide the code you used for loading the data into the table. If you use INSERT VALUES 4 tuples is enough.
-
Write the SQL statement used to group crimes by category, format string so that hyphens are spaces.
-
How many traffic violations were committed in August 2014.
-
Report the top ten categories of crimes for the month of August 2014

PostgreSQL Exercise: Working with Join and other functions
Create and load the following CSV files into database:
-
mn_census_tracts
-
mn_county_pixel_values
And practice with the following queries:
-
Write the select or create statement that results in a new table mn_tracts_2000 that contains the following fields by Total, White_alone Black_alone, American_Indian_alone, Asian_alone Hawaiian_PI_alone, SOR_alone)
-
Write the query necessary for joining the census tracts to the county pixel values table. (This is a zonal-- statistics of landcover types)
-
If you use the count of pixels as a proxy for area, which county has the most people per pixel?
-
Write the select or create statement that results in a new table mn_county that contains the aggregates of the following fields by county (Total, one_race, White_alone Black_alone, American_Indian_alone, Asian_alone Hawaiian_PI_alone, SOR_alone)
-
Create a temporary table and a view for the previous question.
-
What statement removes from the temporary table any records where the countyfp is 37, 19, or 53.

PostgreSQL Exercise: Working with PostGIS Spatial Operators
Create a table and load the mn_census_tracts_2010, and complete the following queries:
-
Generate a single polygon of the state of Minnesota from the census tracts
-
Report the spatial extent of the state of Minnesota
-
Create a polyline that traverses the middle of the state. This can be vertical or horizontal.
-
Splits the state in half (based on your results from question 2) and store it in a table.
-
Returns the census tracts that intersect with the polyline (from question 2)
-
Returns the census tracts that do not intersect with the polyline. Please use 1 query with 1 or more Common Table Expressions or subqueries
-
Creates a view of centroids for MN counties call the view mn_county_centroids.
-
Identifies all random points that are within 5 kilometers of a county centroid
-
Identifies all random points that are within 5 kilometers of the Anoka county centroid
-
Are there any duplicate random points. If so write the SQL that identifies them.
-
Identifies the number of duplicate points within each county.
-
If you were to delete a county in the mn_counties table, what would happen to the mn_county_centroids view

PostgreSQL Exercise: Working with PostGIS and Raster Data
This exercise is to develop expertise in processing spatial raster data with PostGIS using the GLC2000 raster dataset, with the following queries:
-
creates a histogram of the state of Minnesota. A histogram is each unique pixel type and total number of pixels.
-
returns the most common pixel value for each county in Minnesota
-
returns the minimum and maximum value for each county in Minnesota
-
Rewrite query in Question 3 so that it uses a subquery or common table expression
-
reclassifies Mosaic: Croplaand / Shrub or Grass Cover (pixel value = 18 to pixel value 20)
-
Rewrite the query from question 5 to group the non-liveable places to a new pixel value 30. Then count the number of new pixels.
-
reclassifies all trees (Example not the actual values pixel value = [3,4,5,6] ) to a new category forest.
-
uses map algebra that multiplies all your pixel values by 5.

PostgreSQL Exercise: Working with Topological Analysis
Spatial statistics like Moran's I and LISA statistics are not supported in the PostGIS extension as functions.However, with a Spatial database you can use topological functions/rules to understand the spatial relationships in your data.
Create a table and load the mn_population shapefile data, and load the raster datasets, meris_2010 and meris_2015 into the database, and complete the following queries:
-
Write the SQL code to find all the adjacent counties to Ramsey County.
-
Write the SQL that joins the counties to the population table data.
-
Write the SQL code that calculates and sums the total population of all the adjacent counties to Ramsey County.
-
Expand the SQL code in Question 2 so that it calculates the sums the total population of all the adjacent counties in Minnesota. Make sure to not add the counties in Wisconsin, Iowa, Dakota etc.
-
Expand the code in Question 3 and create a choropleth map of question 3 with labels of population for each adjacent county and place the image in your github repo.
-
Write the SQL query that finds all the roads the intersect with I-94.
-
Write the SQL query that determines the all the features outside a 10 mile buffer of I-94.
-
Calculate the histogram of landcover for Hennepin County in 2010. Do not use ST_Histogram, because the raster is an integer.
-
Which landcover types decreased from 2010 to 2015 in Hennepin County.
-
Which counties in MN has a decrease in tree cover (Values 50 through 90).
